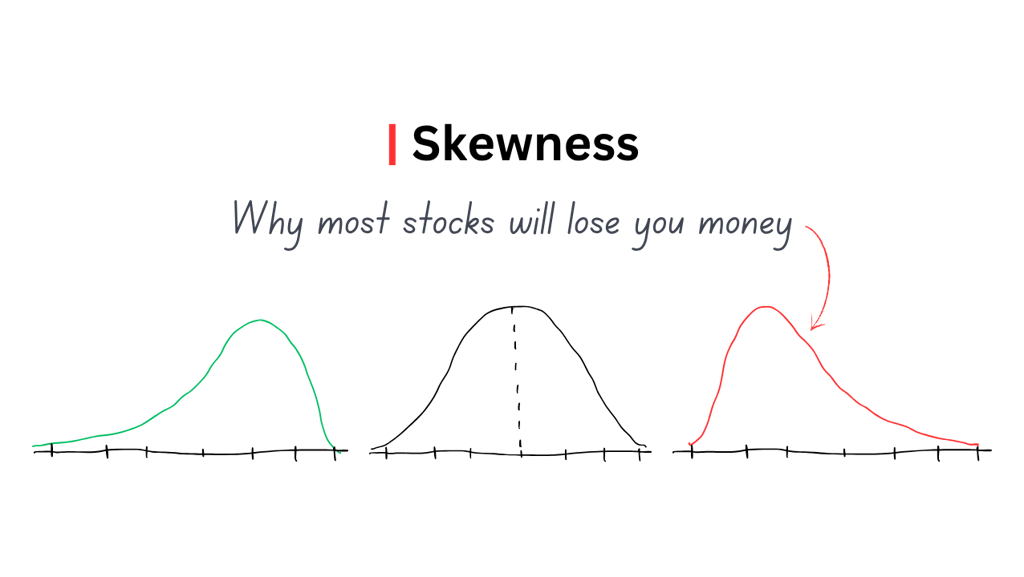
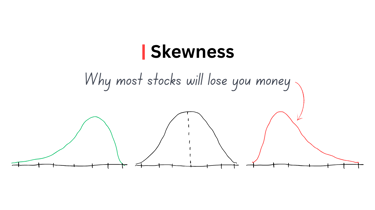
Skewness
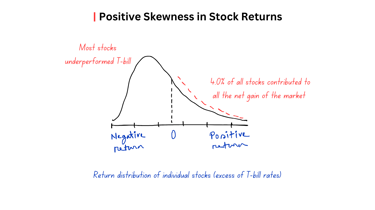
Stock returns are positively skewed
MENTAL MODELSMATHEMATICSNOTES
Md Nazmus Sakib
11/23/20245 min read
We love symmetry. Most things that we consider beautiful have symmetric structure. Look at you. You are a symmetrical being (mostly). Most living things display symmetry in their physical structure and movement. However, asymmetry is pervasive in the natural world and the human world.
Specie with the highest longevity of 15,000 years is Hexactinellid sponge. Second and third in rank are Great basin bristlecone pine and African baobab with maximum lifespan of 5,062 and 2,500 years respectively. These are very large numbers. However, if you plotted the values from 0 to 15,000 years with a mid value of 7,500, most specie would cluster below 150 years while handful of species would stand above 1,000 years. There is a clear skewness or asymmetry.
If you ranked the specie in terms of power dynamics, you would put human to the far right assigning them the highest score and all the other specie would cluster in the left side of the mid value.
In the social hierarchy of the human world, asymmetry abounds. Top 10% of population in most countries possess the largest portion of income and wealth. In the geopolitical landscape, few countries dominate and dictate the world order. Few industries and businesses make most of the aggregated profit. Words we frequently use in our spoken and written languages are small subset of large dictionary of words. Few stocks are responsible for net gain in the market. Asymmetry rules the world.
What is Skewness?
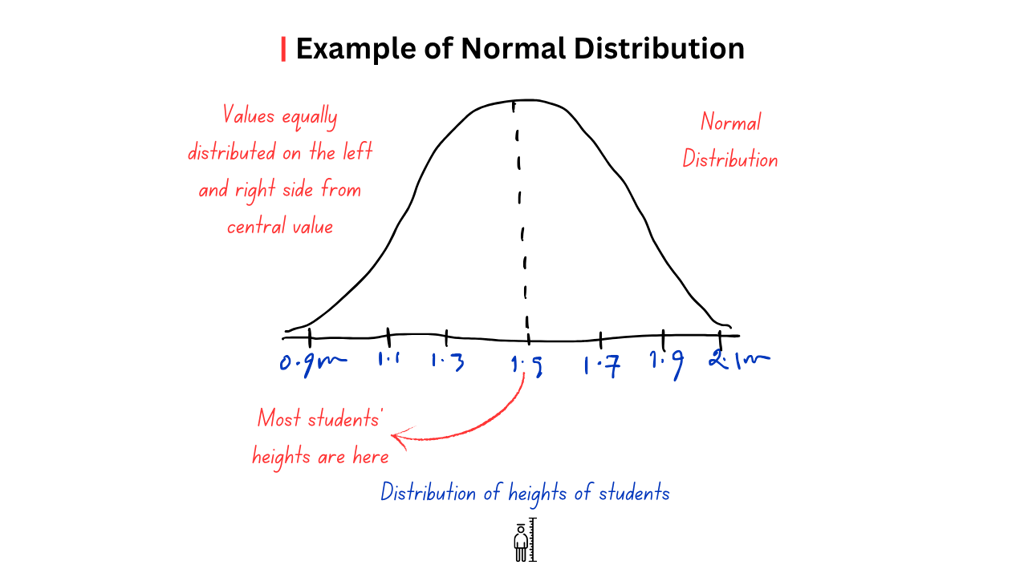
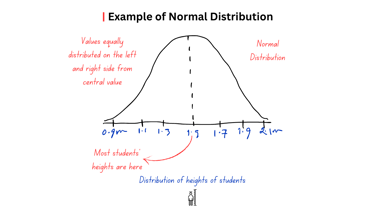
When we first learned about statistics, we initially focused on normal distribution. It’s a beautiful symmetric bell shaped curve. A normal distribution occurs when most values are near the central value and it spreads out evenly from the mid point to the left and right side. For instance, if you plotted the heights of students of a classroom, you would start with the shortest student on the left side of the x axis and move towards the tallest student in the farthest right of the x axis. Most students’ heights are likely to be around the mid value and the distribution of number of students in different height range is likely to be symmetrical from the midpoint.

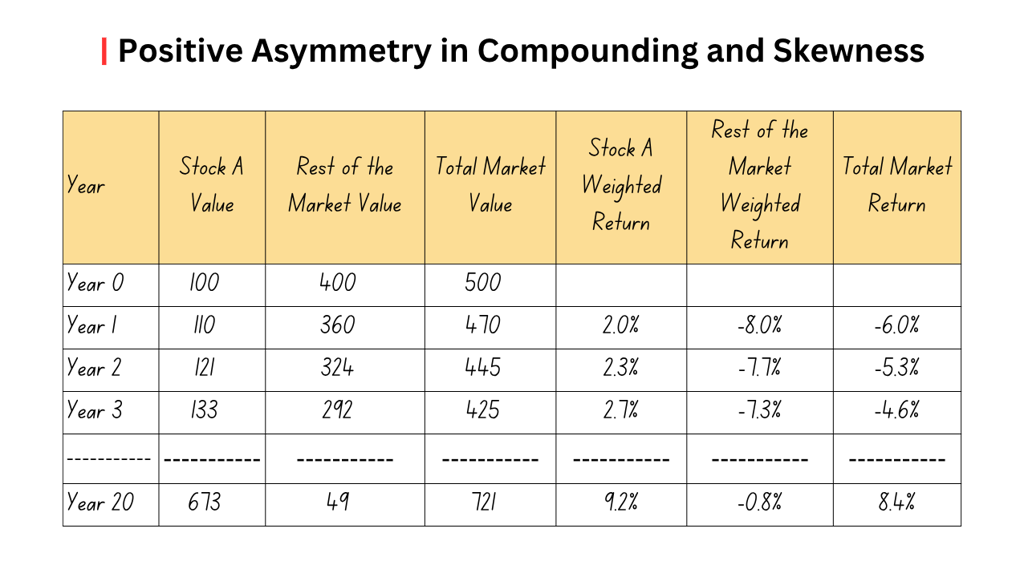
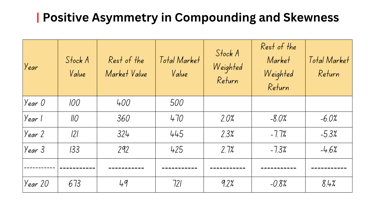
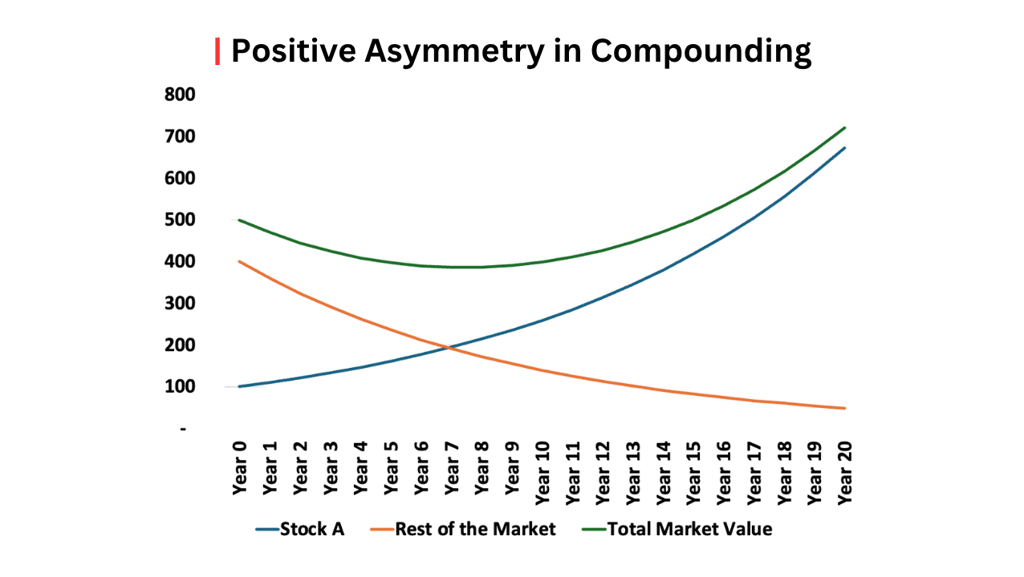
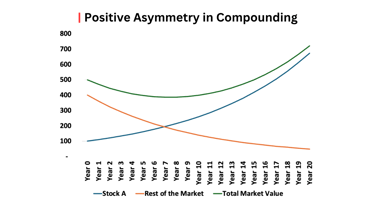
Consider a market with five stocks, each starting with $100 in value. Stock A starts with $100 in value and rest of the market starts with $400 in value. For simplicity, we assume stock A is a great business that compounds shareholder wealth at an annual 10.0% rate for next 20 years while rest of the market declines 10.0% each year in the same timeline. At the end of first year, total market value falls to 470 with a total net return of negative 6.0%. Stock A generates 2.3% weighted return and rest of the market generates weighted return of negative 7.7%. After the first year, rest of the market dominated the total return of the market. What happens after 20 years? After 20 years of compounding, stock A reaches a value of $673, while total market value reaches $721. Now, after 20 years of compounding, due to stock A’s outsized weight in the market, change in Stock A contributes heavily to the overall market return.
Positive Asymmetry in Compounding and How It Contributes to Skewness
Rule of compounding dictates that the upside is unlimited while the downside is limited to zero. When something grows for a long time, it grows at an increasing rate and when something declines, it declines at a decreasing rate. Over the years, the winning stock dominates the market return and the losing ones fade in significance. Any incremental change in the winning stock, after enough compounding, has outsized impact in the overall return of the market.
When you look at this nature of skewness where few companies generate most of the return in the market, you can’t help but ask if there are some general characteristics of these businesses that helped them dominate. Hendrik Bessembinder listed the following common characteristics of the winning businesses/stocks:
Large increases in net income
Rapid asset and sales growth that the company generated internally
A rising return on assets
Above-average research and development spending
Cash accumulation
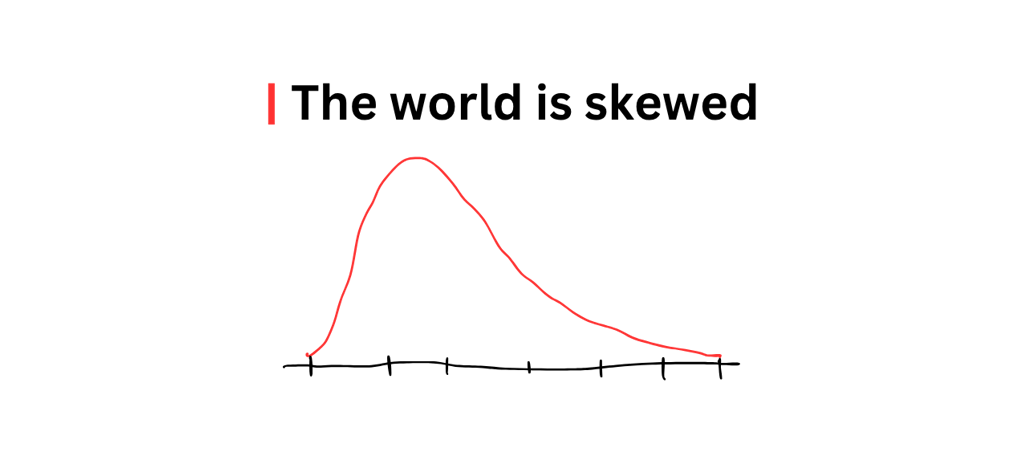
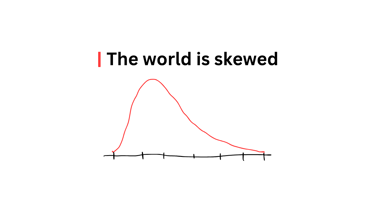
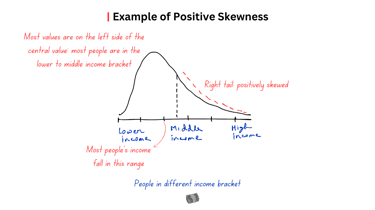
Skewness arises when the distribution is asymmetrical. Positive skewness in distribution arises when most values are on the left side of the central value and there is a long tail on the right side.
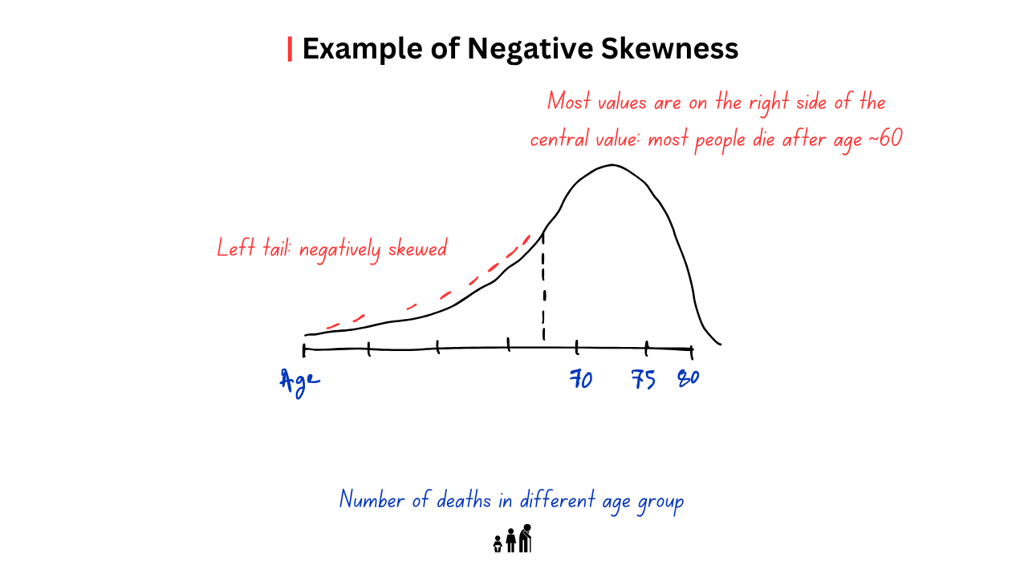
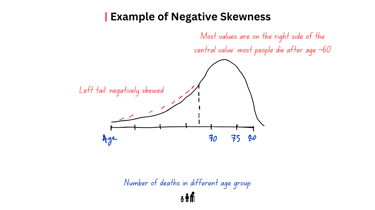
Contrarily, negative skewness in distribution arises when most values are on the right side of the central value and there is a long tail on the left side.
Skewness in Stock Market
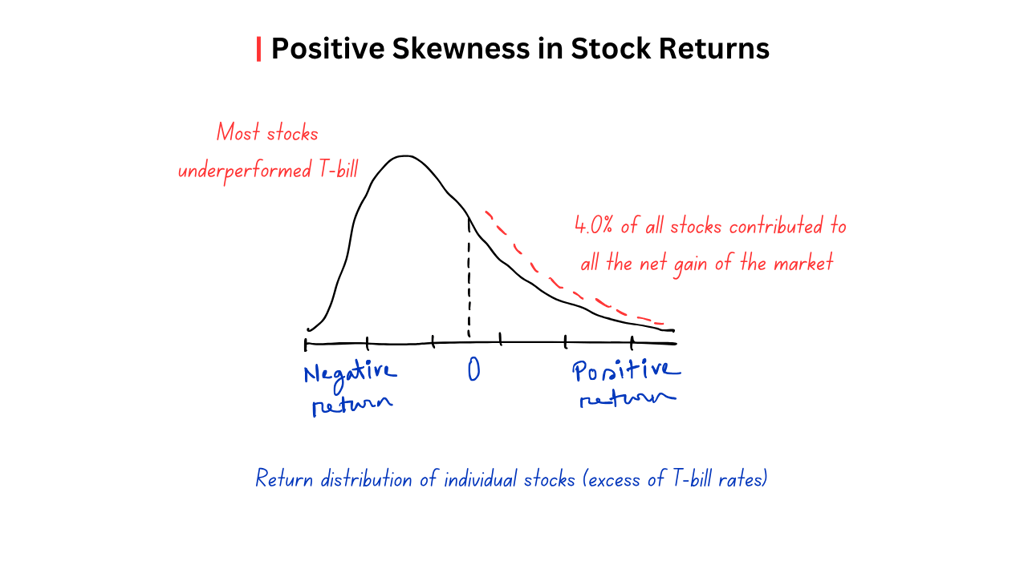
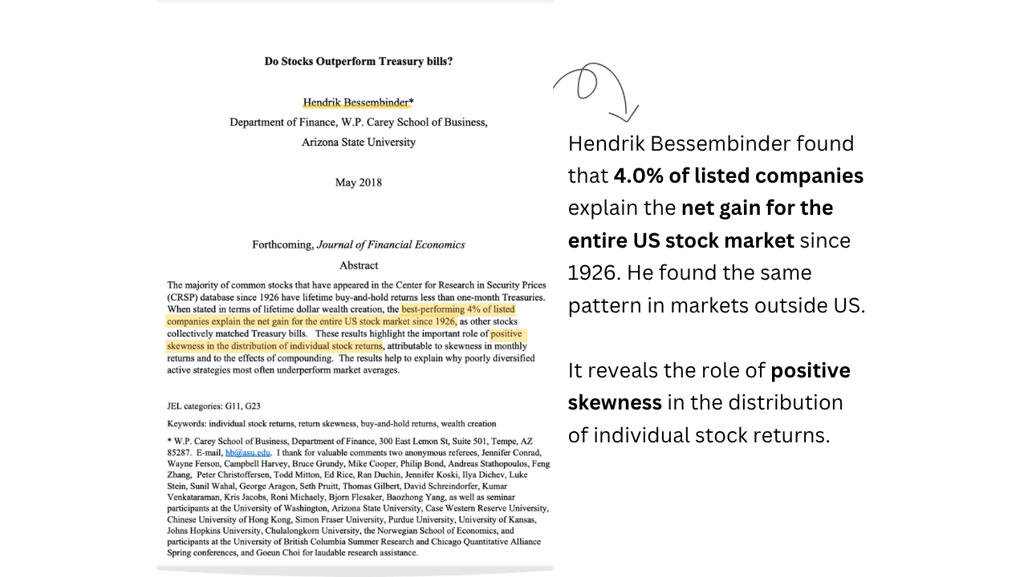
Stock market is not immune from the rule of asymmetry. Few companies make most of the market’s return. It’s the extreme version of 80/20 rule (80% of outcomes result from 20% of causes). Hendrik Bessembinder, in his paper titled 'Do Stocks Outperform Treasury Bills?', found that 4.0% of listed companies explain the net gain for the entire US stock market since 1926. He found the same pattern in markets outside US. It reveals the role of positive skewness in the distribution of individual stock returns.
Great businesses continue to be great for a long time delivering outsized return.
Asymmetric nature of compounding amplify the positive skewness over a long horizon.

What a Skewed Market Means for You as an Investor
Positive skewness nature of market (few stocks responsible for most of the market return) solidifies the logic behind diversification (especially if you don’t have any edge) and staying invested for long horizon. You can definitely chase those few winning stocks and try to beat the market but a concentrated portfolio will always have the risk of not being able to recognise the winning stocks especially when there is so few of them.